Comparing short-read mappers for non-model species
09 March 2017
Tweet
One of the first and most important steps in most (not all) genomics analyses is mapping your reads to a reference genome. If you work on a species without a reference genome, mapping can be particularly tricky - on top of errors from DNA extraction, library preps, and sequencing, you have the added headache that you might be expecting a lot of true biological differences between your reads (from your study species) and your reference genome (from some other species). These differences will include SNPs, indels, and possibly bigger differences like inversions or large chromosomal rearrangements. All of them make mapping a lot harder.
In my lab, we work a lot on Eucalyptus species. The best reference is from Eucalyptus grandis, and the species we work on tend to be about 5% diverged (in terms of SNPs) from E. grandis. Luckily (and one of the reasons we think Eucalyptus is a reasonable model system for doing non-model genomics) the structural characteristics of Eucalyptus genomes seem to be quite evolutionarily stable. Nevertheless, 5% divergence presents a big challenge for mapping reads: if about 1 in 20 bases is different from the reference genome, we’ll need to work hard to choose the best mapping software. I’ve tweeted a lot of this post already, but below are more gory details of what I did, why, and what I think it means.
You can find all of the code (and links to the relevant software) I used for this post here.
I chose to compare 4 pieces mapping software: BWA-MEM, bbmap, Stampy, and NextGenMap. Broadly speaking, I chose these because: (i) everyone uses BWA-MEM, and it seems pretty great; (ii) bbmap seems potentially really useful and quick from reading the various forums; (iii) Stampy is supposed to be really good at mapping reads with lots of differences from the reference; (iv) NextGenMap claims to be as good as Stampy, but quicker. Fundamentally, the difference between the mappers is that the first two are Burrows-Wheeler aligners, the second two are hash-based aligners. One might prefer a hash-based aligner for mapping to divergent reference genomes. But the current status-quo seems to be either to rely on BWA-MEM, or perhaps to use BWA-MEM and then use Stampy to try and map the reads that BWA-MEM couldn’t. This hybrid approach is suggested by the Stampy authors, because Stampy on its own can be pretty slow.
The data I’m using here is a single sample of a 100bp paired-end data from a Eucalyptus melliodora tree, sequenced on a HiSeq. There are ~71m reads in total. I’m going to map them to a reference made up of the E. grandis assembly, plus the E. grandis mitochondrial scaffolds, plus the E. melliodora chloroplast genome. Our fragment sizes were a bit smaller than we would have liked for this library, so we’re expecting insert sizes of a couple of hundred base pairs.
All I’m going to do is run each of the pieces of software with default settings, using 20 cores on my server. This is pretty common practice, though I understand some other software like Bowtie benefits from some optimisation, which is one reason I didn’t include it here. Either way, for my purposes default settings serves as a good jumping off point for further investigation.
For each piece of software, I’m going to record the compute time to the nearest minute and a bunch of commonly-measured statistics. For my mapping stats I just use Qualimap, and apart from the total percentage of all reads mapped I’ll calculate all the stats from just the genes only on the first 11 scaffolds. I do this for a couple of reasons: (i) the first 11 scaffolds are the ‘real’ chromosomes of E. grandis, after that there are ~50k little scaffolds that couldn’t be assembled properly; (ii) Eucalyptus genomes are about 40% repeats, and for sure I am not going to be making any inferences from repeat regions with 100bp PE data for my purposes, focussing on genes means I can avoid this with most of my stats. Also note that when I run the mappers, each one has to first index the reference genome. So the timings below include both steps. This isn’t perfect, but you’ll see why it doesn’t matter.
Here’s what happened:
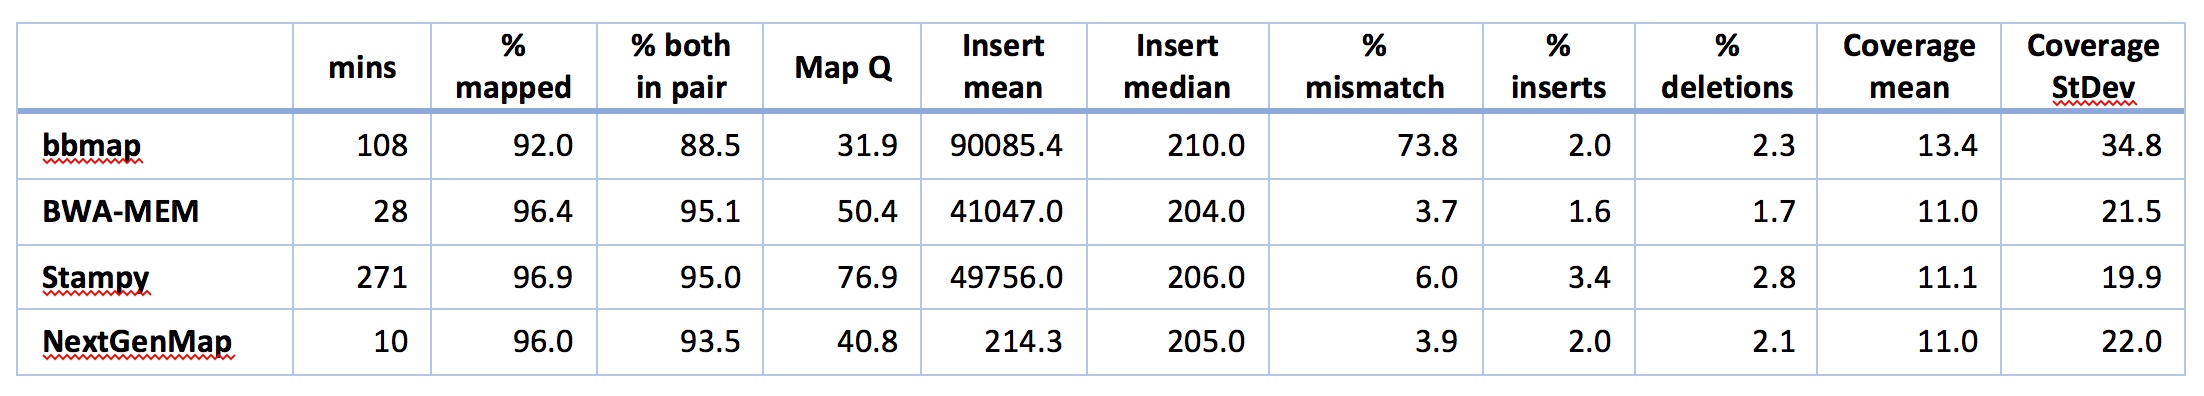
There’s lots to take in there, so lets walk through it. But bear in mind that with the exception of the time taken for the analysis, many of these things can probably be improved by doing some standard parameter tweaks in the software. Also bear in mind that a lot of software has defaults that are set up specifically for folks with reference genomes from the same species, so this might not be a fair comparison. With that in mind, LOOK AT THE TIME FOR ANALYSIS!! Just LOOK AT IT.
Remember that the execution time includes the time to index the reference genome. Then note that NextGenMap is evaluating ~71m reads and mapping most of them successfully in 10 minutes!!! This is about 3 times faster than the next best option (BWA-MEM), and ~30 times taster than Stampy, the other hash-based mapper. So, NextGenMap is looking pretty good at this point.
I’ll start by saying that neither bbmap nor Stampy look good for my purposes here. Both are very slow compared to the others. Both have mismatch rates that worry me a little (Stampy is 6%, and we’re expecting something <5% here, given that the overall reference is ~5% difference and we’re looking at genes, which should be more conserved than the reference as a whole) or a lot (bbmap has a mismatch rate of 73%: clearly something is going on that I don’t understand here). I’m also suspicious of the coverage for bbmap - both the mean and the standard deviation are high, suggesting that there are regions where bbmap is mapping A LOT of reads that are quite divergent, upping both the mean, the standard deviation, and the mismatch rate. bbmaps overall mapping rate is also low compared to the others. So, let’s count them out and move on to BWA-MEM and NextGenMap.
Both NextGenMap and BWA-MEM look good to mee. Both are quick (though NextGenMap is almost 3x quicker). Both map ~96% of the reads. BWA-MEM maps a few more good pairs, coverage looks about right for both, and most of the rest of the stats look very similar and perfectly acceptable for both bits of software. There are two obvious exceptions: mapping quality and mean insert size. You might be tempted to look at the mapping qualities and think that BWA-MEM is better than NextGenMap, but that would be a mistake. There is no standard way of calculating mapping qualities, so they’re not actually comparable between pieces of software. The insert sizes are interesting. All the software except NextGenMap gives huge means, and very sensible medians, suggesting that a small proportion of reads have MASSIVE insert sizes. This isn’t unexpected - a few rearrangements between E. grandis and E. melliodora would cause this, as would a few assembly errors or mapping errors. NextGenMap has means and medians both around 200: the mean is a little higher, suggesting a few large insert sizes. I don’t yet understand the differences here very well - that will take some more digging.
It’s easy to dig a little deeper, and look at things like coverage and insert sizes across the reference sequence. Here are some plots from Qualimap for side-by-side comparisons of NextGenMap (top row) and BWA-MEM (bottom row) coverage.
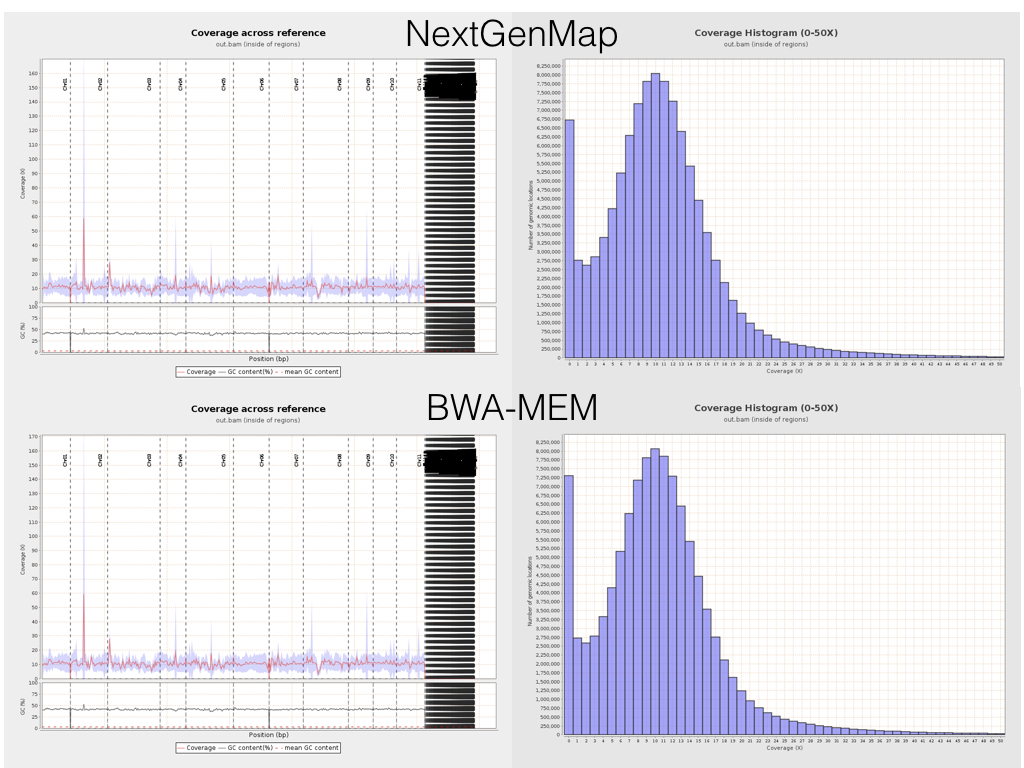
This is really encouraging. The plots are basically identical, suggesting that at this crude scale (mapping to genes, and summarising it in an utterly zoomed out way), both mappers are doing fundamentally the same thing. Given that they are based on such different underlying principles, this is great. Indeed, looking at the mapping in IGV, it’s clear that these mappers really are doing very similar (though not identical of course) things.
One interesting difference arises if you look at the insert sizes across the reference. Below is a plot with the insert size across the reference from all four bits of software. Spot the odd one out (note that the Y axis differ in each plot...).
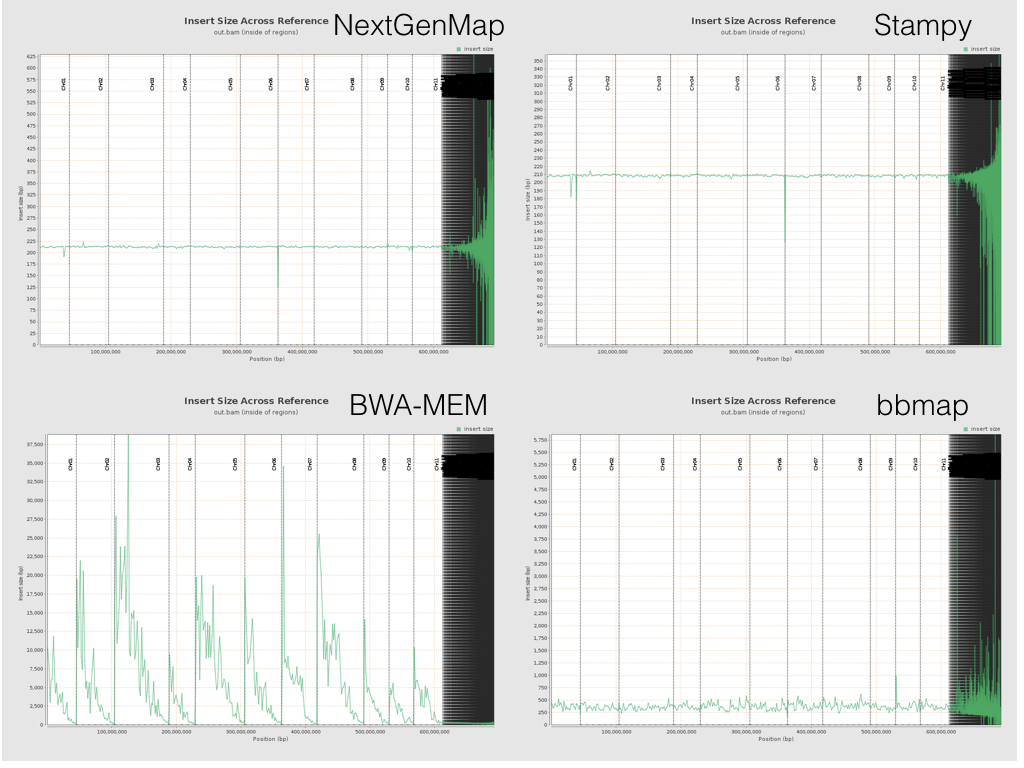
All the software except BWA-MEM behaves roughly as expected. Insert sizes sit somewhere around ~200bp within genes for all of the 11 chromosomes. (They all go a bit crazy after that, because the ~50k tiny scaffolds on the right of each plot are poorly assembled). But BWA-MEM’s insert sizes are, um, a little different. They start high (very high) at the start of each chromosome, and drop down towards the end. The pattern is the same if you look at insert sizes in the whole genome, not just in the genes (the plots above are the latter). Exactly why this happens is still a mystery to me, and apparently to others too. If you have ideas, feel free to leave them on the issue I created on the BWA-MEM GitHub repo or below. Our best guess so far is that this has something to do with cases when BWA-MEM is labelling reads as having been mapped independently (as opposed to in a good pair), and Qualimap not picking up these labels. I’m still baffled as to the within-chromosome patterns though.
Either way though, the upshot of all of this seems to be that NextGenMap and BWA-MEM both perform well here. I lean towards NextGenMap as the tool for the job - hash-based mappers are explicitly designed to be better at mapping to divergent reference sequences, NextGenMap performs very similarly to BWA-MEM (assuming this insert size thing is nothing serious, which I think it probably isn’t), and is ~3x faster with default settings. The huge advantage of that is that, because mapping is the bottleneck for us, this speeds up everything we do, and means we can try more things.
The obvious next step here is to play with settings in NextGenMap a little. There’s one key setting in NextGenMap - the ‘-s’ or speed setting. The lower you set this the harder NextGenMap will try to map each read. By default, NextGenMap does something smart to estimate this parameter from the data. On the analysis above it estimates it at 0.53. So, what happens if I set it lower?
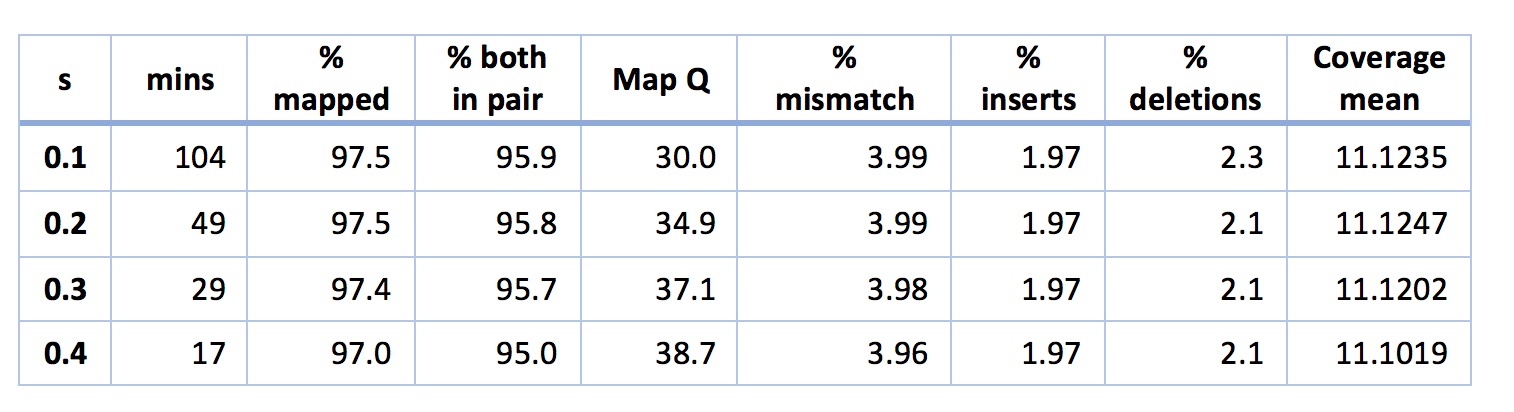
The short story is that it works great. It looks like I can map slightly better than BWA-MEM in the same time, without worrying about that insert size pattern. Another thing of note is that even when s is really low (e.g. 0.1) my mismatch percentage stays stable at ~4%. This indicates to me that NextGenMap is not just picking up horrible reads (e.g. contaminants) and mapping them. If this were the case, the mismatch percentage should start to rise. Finally, you might be tempted by the above to worry that the mapping quality is decreasing as s decreases. You shouldn’t worry. Another quirk of mapping quality in many mappers (including NextGenMap) is that they give a read a quality of zero if it could have mapped equally well to two places. The lower you put s, the more places NextGenMap will try to map each read, so the more often it will map to two places equally well. Mapping qualities, it seems, are sent to try us.
Some background
One of the first and most important steps in most (not all) genomics analyses is mapping your reads to a reference genome. If you work on a species without a reference genome, mapping can be particularly tricky - on top of errors from DNA extraction, library preps, and sequencing, you have the added headache that you might be expecting a lot of true biological differences between your reads (from your study species) and your reference genome (from some other species). These differences will include SNPs, indels, and possibly bigger differences like inversions or large chromosomal rearrangements. All of them make mapping a lot harder.
In my lab, we work a lot on Eucalyptus species. The best reference is from Eucalyptus grandis, and the species we work on tend to be about 5% diverged (in terms of SNPs) from E. grandis. Luckily (and one of the reasons we think Eucalyptus is a reasonable model system for doing non-model genomics) the structural characteristics of Eucalyptus genomes seem to be quite evolutionarily stable. Nevertheless, 5% divergence presents a big challenge for mapping reads: if about 1 in 20 bases is different from the reference genome, we’ll need to work hard to choose the best mapping software. I’ve tweeted a lot of this post already, but below are more gory details of what I did, why, and what I think it means.
You can find all of the code (and links to the relevant software) I used for this post here.
The software
I chose to compare 4 pieces mapping software: BWA-MEM, bbmap, Stampy, and NextGenMap. Broadly speaking, I chose these because: (i) everyone uses BWA-MEM, and it seems pretty great; (ii) bbmap seems potentially really useful and quick from reading the various forums; (iii) Stampy is supposed to be really good at mapping reads with lots of differences from the reference; (iv) NextGenMap claims to be as good as Stampy, but quicker. Fundamentally, the difference between the mappers is that the first two are Burrows-Wheeler aligners, the second two are hash-based aligners. One might prefer a hash-based aligner for mapping to divergent reference genomes. But the current status-quo seems to be either to rely on BWA-MEM, or perhaps to use BWA-MEM and then use Stampy to try and map the reads that BWA-MEM couldn’t. This hybrid approach is suggested by the Stampy authors, because Stampy on its own can be pretty slow.
The data
The data I’m using here is a single sample of a 100bp paired-end data from a Eucalyptus melliodora tree, sequenced on a HiSeq. There are ~71m reads in total. I’m going to map them to a reference made up of the E. grandis assembly, plus the E. grandis mitochondrial scaffolds, plus the E. melliodora chloroplast genome. Our fragment sizes were a bit smaller than we would have liked for this library, so we’re expecting insert sizes of a couple of hundred base pairs.
Analysis 1: default settings
All I’m going to do is run each of the pieces of software with default settings, using 20 cores on my server. This is pretty common practice, though I understand some other software like Bowtie benefits from some optimisation, which is one reason I didn’t include it here. Either way, for my purposes default settings serves as a good jumping off point for further investigation.
For each piece of software, I’m going to record the compute time to the nearest minute and a bunch of commonly-measured statistics. For my mapping stats I just use Qualimap, and apart from the total percentage of all reads mapped I’ll calculate all the stats from just the genes only on the first 11 scaffolds. I do this for a couple of reasons: (i) the first 11 scaffolds are the ‘real’ chromosomes of E. grandis, after that there are ~50k little scaffolds that couldn’t be assembled properly; (ii) Eucalyptus genomes are about 40% repeats, and for sure I am not going to be making any inferences from repeat regions with 100bp PE data for my purposes, focussing on genes means I can avoid this with most of my stats. Also note that when I run the mappers, each one has to first index the reference genome. So the timings below include both steps. This isn’t perfect, but you’ll see why it doesn’t matter.
Here’s what happened:
There’s lots to take in there, so lets walk through it. But bear in mind that with the exception of the time taken for the analysis, many of these things can probably be improved by doing some standard parameter tweaks in the software. Also bear in mind that a lot of software has defaults that are set up specifically for folks with reference genomes from the same species, so this might not be a fair comparison. With that in mind, LOOK AT THE TIME FOR ANALYSIS!! Just LOOK AT IT.
Remember that the execution time includes the time to index the reference genome. Then note that NextGenMap is evaluating ~71m reads and mapping most of them successfully in 10 minutes!!! This is about 3 times faster than the next best option (BWA-MEM), and ~30 times taster than Stampy, the other hash-based mapper. So, NextGenMap is looking pretty good at this point.
I’ll start by saying that neither bbmap nor Stampy look good for my purposes here. Both are very slow compared to the others. Both have mismatch rates that worry me a little (Stampy is 6%, and we’re expecting something <5% here, given that the overall reference is ~5% difference and we’re looking at genes, which should be more conserved than the reference as a whole) or a lot (bbmap has a mismatch rate of 73%: clearly something is going on that I don’t understand here). I’m also suspicious of the coverage for bbmap - both the mean and the standard deviation are high, suggesting that there are regions where bbmap is mapping A LOT of reads that are quite divergent, upping both the mean, the standard deviation, and the mismatch rate. bbmaps overall mapping rate is also low compared to the others. So, let’s count them out and move on to BWA-MEM and NextGenMap.
Both NextGenMap and BWA-MEM look good to mee. Both are quick (though NextGenMap is almost 3x quicker). Both map ~96% of the reads. BWA-MEM maps a few more good pairs, coverage looks about right for both, and most of the rest of the stats look very similar and perfectly acceptable for both bits of software. There are two obvious exceptions: mapping quality and mean insert size. You might be tempted to look at the mapping qualities and think that BWA-MEM is better than NextGenMap, but that would be a mistake. There is no standard way of calculating mapping qualities, so they’re not actually comparable between pieces of software. The insert sizes are interesting. All the software except NextGenMap gives huge means, and very sensible medians, suggesting that a small proportion of reads have MASSIVE insert sizes. This isn’t unexpected - a few rearrangements between E. grandis and E. melliodora would cause this, as would a few assembly errors or mapping errors. NextGenMap has means and medians both around 200: the mean is a little higher, suggesting a few large insert sizes. I don’t yet understand the differences here very well - that will take some more digging.
It’s easy to dig a little deeper, and look at things like coverage and insert sizes across the reference sequence. Here are some plots from Qualimap for side-by-side comparisons of NextGenMap (top row) and BWA-MEM (bottom row) coverage.
This is really encouraging. The plots are basically identical, suggesting that at this crude scale (mapping to genes, and summarising it in an utterly zoomed out way), both mappers are doing fundamentally the same thing. Given that they are based on such different underlying principles, this is great. Indeed, looking at the mapping in IGV, it’s clear that these mappers really are doing very similar (though not identical of course) things.
One interesting difference arises if you look at the insert sizes across the reference. Below is a plot with the insert size across the reference from all four bits of software. Spot the odd one out (note that the Y axis differ in each plot...).
All the software except BWA-MEM behaves roughly as expected. Insert sizes sit somewhere around ~200bp within genes for all of the 11 chromosomes. (They all go a bit crazy after that, because the ~50k tiny scaffolds on the right of each plot are poorly assembled). But BWA-MEM’s insert sizes are, um, a little different. They start high (very high) at the start of each chromosome, and drop down towards the end. The pattern is the same if you look at insert sizes in the whole genome, not just in the genes (the plots above are the latter). Exactly why this happens is still a mystery to me, and apparently to others too. If you have ideas, feel free to leave them on the issue I created on the BWA-MEM GitHub repo or below. Our best guess so far is that this has something to do with cases when BWA-MEM is labelling reads as having been mapped independently (as opposed to in a good pair), and Qualimap not picking up these labels. I’m still baffled as to the within-chromosome patterns though.
Either way though, the upshot of all of this seems to be that NextGenMap and BWA-MEM both perform well here. I lean towards NextGenMap as the tool for the job - hash-based mappers are explicitly designed to be better at mapping to divergent reference sequences, NextGenMap performs very similarly to BWA-MEM (assuming this insert size thing is nothing serious, which I think it probably isn’t), and is ~3x faster with default settings. The huge advantage of that is that, because mapping is the bottleneck for us, this speeds up everything we do, and means we can try more things.
Analysis 2: optimising NextGenMap
The obvious next step here is to play with settings in NextGenMap a little. There’s one key setting in NextGenMap - the ‘-s’ or speed setting. The lower you set this the harder NextGenMap will try to map each read. By default, NextGenMap does something smart to estimate this parameter from the data. On the analysis above it estimates it at 0.53. So, what happens if I set it lower?
The short story is that it works great. It looks like I can map slightly better than BWA-MEM in the same time, without worrying about that insert size pattern. Another thing of note is that even when s is really low (e.g. 0.1) my mismatch percentage stays stable at ~4%. This indicates to me that NextGenMap is not just picking up horrible reads (e.g. contaminants) and mapping them. If this were the case, the mismatch percentage should start to rise. Finally, you might be tempted by the above to worry that the mapping quality is decreasing as s decreases. You shouldn’t worry. Another quirk of mapping quality in many mappers (including NextGenMap) is that they give a read a quality of zero if it could have mapped equally well to two places. The lower you put s, the more places NextGenMap will try to map each read, so the more often it will map to two places equally well. Mapping qualities, it seems, are sent to try us.